Data & statistics30 / 68
Confidence intervals & tests
Use a statistical test only when the data and assumptions match the method. The result helps assess evidence; it does not prove a hypothesis.
Find itData → table → Statistics & plots → Mean inference / Additional hypothesis tests
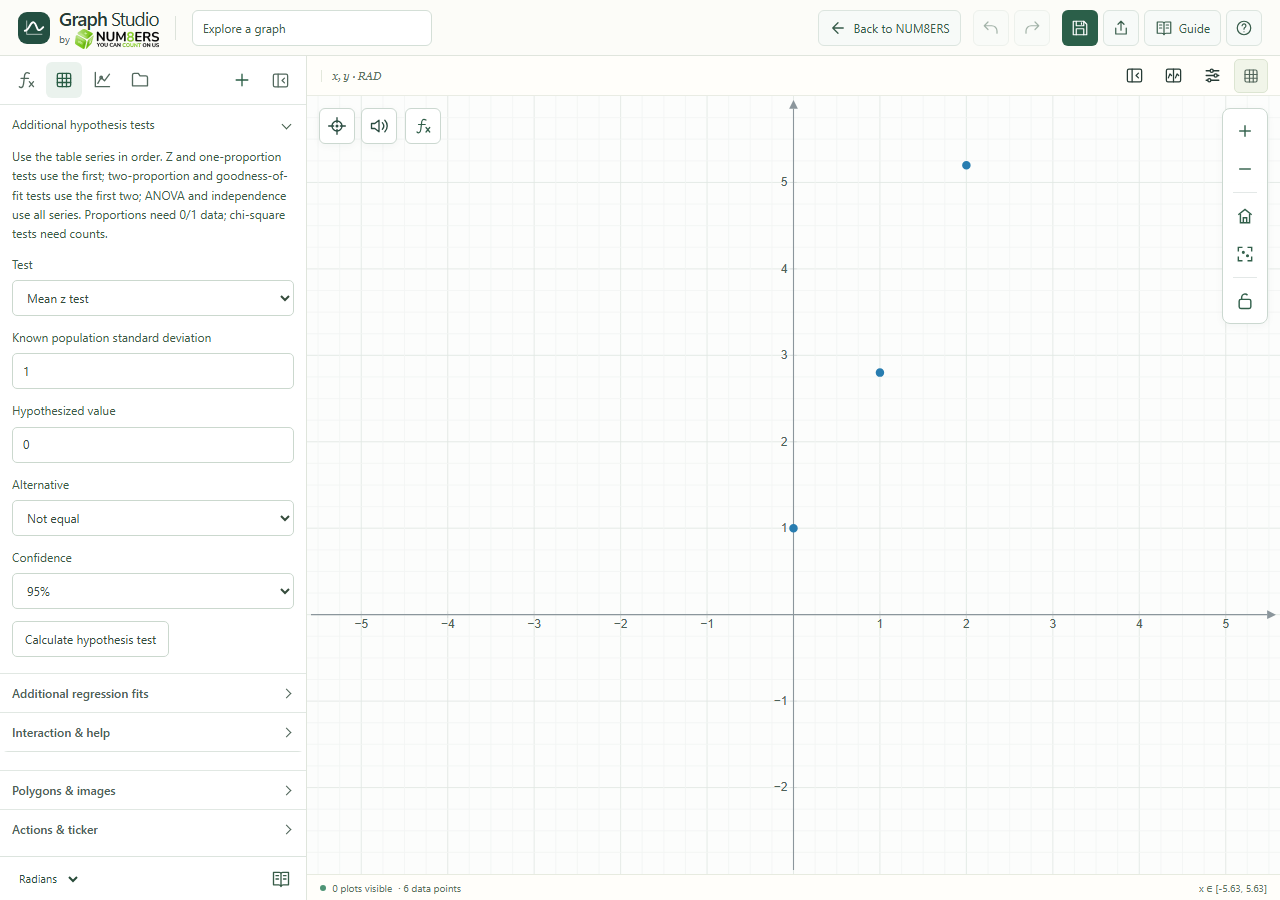 Additional hypothesis tests explain how table series are used and expose the test inputs.Click to enlarge ↗
Try it step by step
- Choose the test that matches your research question and data type.
- Prepare the table series in the required order.
- Enter the hypothesized value, confidence level and alternative when offered.
- Calculate and read the statistic, p value, degrees of freedom, confidence interval, assumptions and warnings.
Options explained
- One-sample / Welch t test
- Compare a mean with a hypothesized value or compare two independent samples. For paired observations, calculate differences first.
- Mean z test
- Uses the first series and a known population standard deviation.
- One / two-proportion z
- Use 0/1 observations; the first series supplies the one-sample test, and the first two supply the two-sample test.
- Chi-square goodness of fit
- Use the first two series as observed and expected counts.
- Chi-square independence
- Uses count data arranged across all series as a contingency table.
- One-way ANOVA
- Uses all series as groups.
- Alternative / confidence
- Where supported, choose not equal, less than or greater than, and 90%, 95% or 99% confidence. Mean intervals shown by the t tool are two-sided.