
Skip to guide content
Graph Studio by NUM8ERSStudent guideOpen calculator
LEARN · TRY · EXPLORE

Data & statistics31 / 68

Probability distributions

Create a distribution, calculate probabilities or quantiles, and draw reproducible random samples.

Find it

Expressions
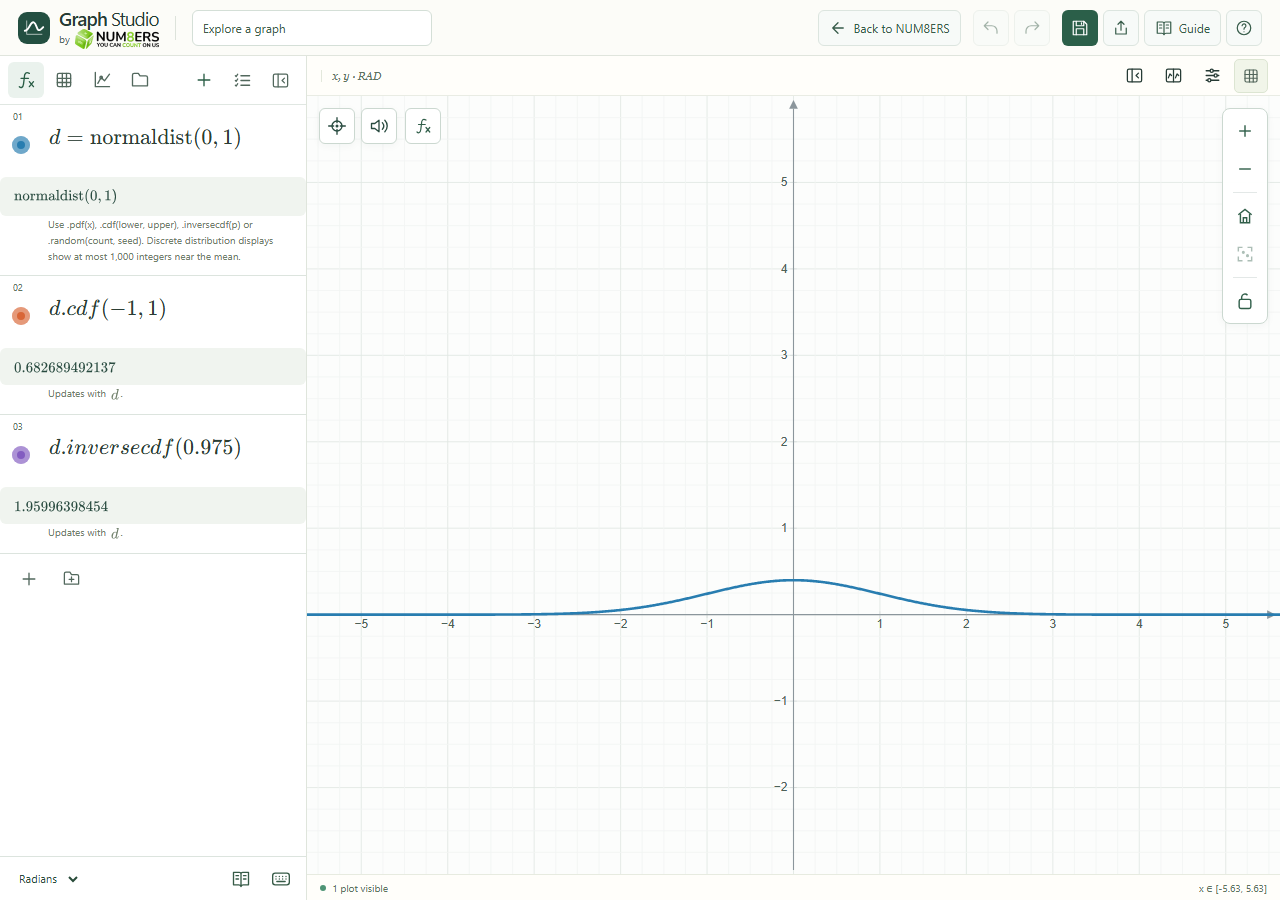
A normal distribution with probability and quantile calculations.
A normal distribution with probability and quantile calculations.Click to enlarge ↗

Try it step by step

  1. Define a distribution such as .
  2. Use its pdf, cdf or inversecdf method for the question you want to answer.
  3. Use mean or stdev to inspect its parameters.
  4. Use random(count,seed) to draw a repeatable sample.

Examples to try

Each card is one input. For definitions, enter the cards in order. Formula-only cards belong in the tool described above.

Standard normal distribution.

Probability within one standard deviation.

Approximately 1.96.

Options explained

Available distributions
normaldist, uniformdist, tdist, chisqdist, binomialdist, poissondist, exponentialdist and geodist. Each checks its parameter domain.
pdf(x)
Density for a continuous distribution or probability mass for a discrete one. A continuous density value is not itself an interval probability.
cdf(x) / cdf(lower,upper)
Cumulative probability or probability over a supported interval.
inversecdf(p)
Finds a quantile for a probability between 0 and 1.
mean() / stdev()
Returns a supported distribution summary.
random(count,seed)
Draws samples; supply a fixed seed to reproduce them. Distribution sampling has its own count limit of 1,000.
Display
Discrete distribution plots show at most 1,000 integers near the mean.

Screenshot

Copy this text

Your browser could not copy automatically. Select and copy the text below.