
Skip to guide content
Graph Studio by NUM8ERSStudent guideOpen calculator
LEARN · TRY · EXPLORE

Expressions & functions08 / 68

Equations, inequalities & regions

Graph Studio can draw relations involving both coordinates and shade the points that satisfy an inequality.

Find it

Expressions
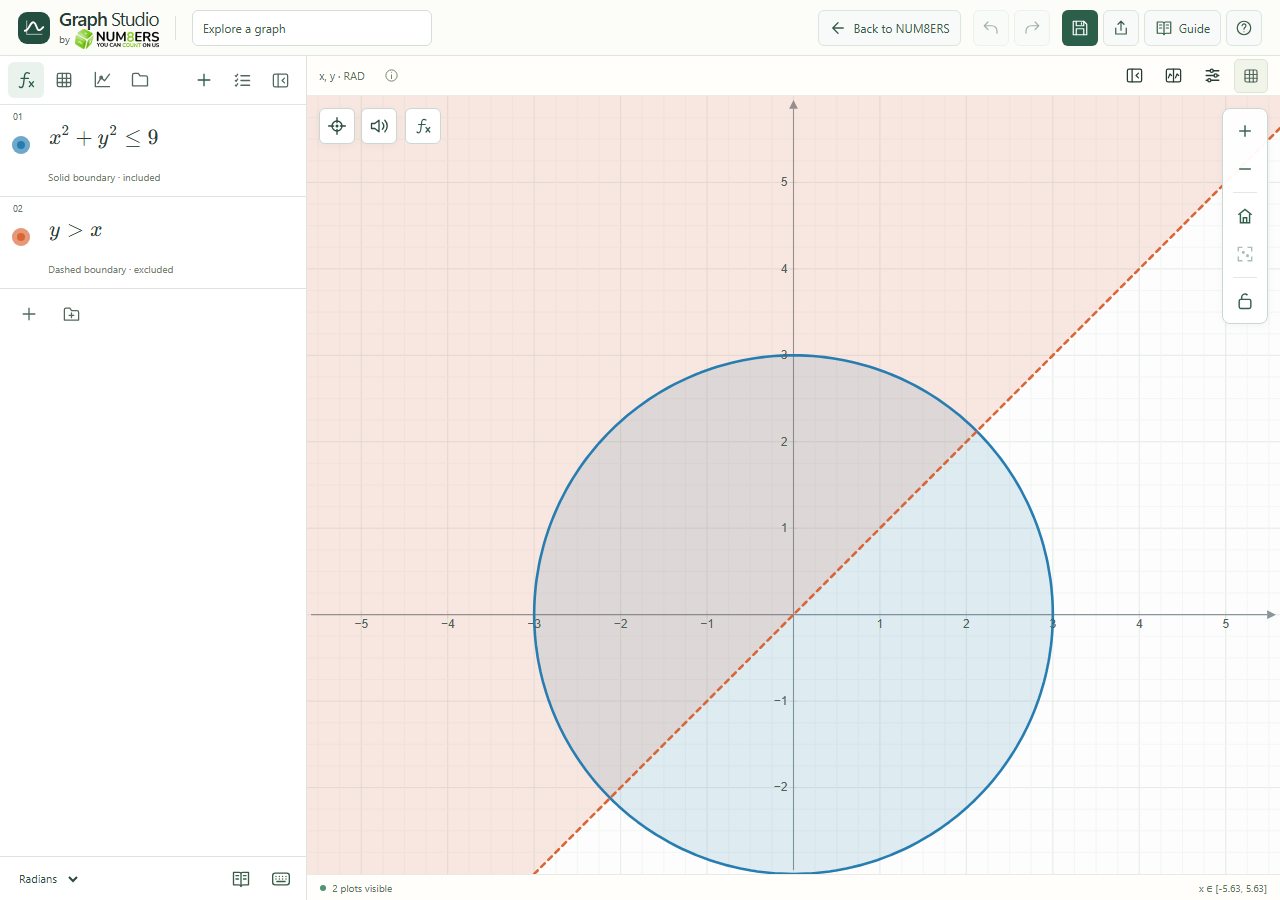
Two shaded regions with included and strict boundaries.
Two shaded regions with included and strict boundaries.Click to enlarge ↗

Try it step by step

  1. Enter an equation such as .
  2. Replace equality with an inequality to shade a region.
  3. Combine upper and lower limits with a chained inequality or use a domain restriction.
  4. Check whether each boundary is solid or dashed before interpreting included points.

Examples to try

Each card is one input. For definitions, enter the cards in order. Formula-only cards belong in the tool described above.

Circle of radius 3.

The disk including its boundary.

A mixed-boundary region.

Options explained

Implicit equation
An equation containing both x and y is drawn as a sampled contour.
Strict boundary
Less than or greater than excludes equality; the boundary is dashed.
Included boundary
Less than or equal / greater than or equal includes equality; the boundary is solid.
Mixed chains
Each part of a chained region retains its own strict or included boundary.
Polar inequalities
Supported polar relations shade a region over their angle interval.
Approximate contours
Tiny loops, narrow strips or closely spaced branches may need a closer zoom and can be missed by finite sampling.

Screenshot

Copy this text

Your browser could not copy automatically. Select and copy the text below.